If you’re looking to develop or debug a website, understanding how JavaScript works within web browsers can be a valuable tool. In particular, Chrome’s Developer Tools make it easy to view, edit, and debug JavaScript code. This article will cover everything you need to know to get started.
Understanding JavaScript in Web Browsers
JavaScript is a programming language commonly used in web development to add interactivity and dynamic functionality to websites. It was created in 1995 by Brendan Eich, then an employee of Netscape Communications Corporation, to make websites more engaging and responsive. Since then, JavaScript has become an essential tool for web developers worldwide.
Web browsers are responsible for executing JavaScript code, which makes them an important tool for developers and programmers to use and explore. JavaScript is a client-side language, which means it runs on the user’s computer, rather than on the server. This allows websites to be more responsive and interactive, as the user’s computer can handle some of the processing power required to run the code.
The Role of JavaScript in Web Development
JavaScript can be used to perform a wide range of tasks, from simple image slideshows to complex web applications. It can be used to validate user input, create animations, and even communicate with servers to update data in real-time. Understanding how it works within web browsers can help you see how a website functions and identify any problems that may arise.
One of the most important things to understand about JavaScript is that it is event-driven. This means that the code is executed in response to user actions, such as clicking a button or typing in a form field. This makes it a powerful tool for creating dynamic and responsive user interfaces.
How Chrome Handles JavaScript
Chrome’s rendering engine, known as Blink, is responsible for processing and executing JavaScript code within the browser. With the help of Chrome’s Developer Tools, you can view and analyze this code in real-time. This can be incredibly useful for debugging and optimizing your code, as you can see exactly how it is being executed by the browser.
One of the key features of Chrome’s Developer Tools is the ability to set breakpoints in your code. This allows you to pause the execution of your code at a specific point and inspect the values of variables and other data. This can be incredibly helpful for identifying bugs and other issues in your code.
In addition to debugging tools, Chrome’s Developer Tools also include a range of performance analysis tools. These can help you identify areas of your code that may be causing performance issues, such as slow-loading scripts or memory leaks.
Overall, understanding how JavaScript works within web browsers is essential for any web developer. By understanding the basics of JavaScript and how it is executed by browsers like Chrome, you can create more engaging and responsive websites that provide a better user experience.
Opening Chrome Developer Tools
Chrome Developer Tools is a powerful feature that allows you to view and edit the code of web pages. Before you can begin using it, you’ll need to open the Developer Tools. There are several ways to do this:
Accessing Developer Tools via Menu
The easiest way to open the Developer Tools is by accessing it through the Chrome menu. Here’s how:
- Open the Chrome browser on your computer;
- Navigate to the web page that you want to inspect;
- Right-click anywhere on the page to open the context menu;
- Select “Inspect” from the dropdown menu;
- This will open the Developer Tools in a separate window.
Once you have the Developer Tools window open, you can start exploring the code of the web page.
Using Keyboard Shortcuts
If you prefer using keyboard shortcuts, you can use them to open the Developer Tools as well. Here’s how:
- On a PC, you can press Ctrl + Shift + J to open the Developer Tools;
- On a Mac, you can press Cmd + Opt + J to open the Developer Tools.
Using keyboard shortcuts can save you time and make it easier to access the Developer Tools quickly.
Once you have the Developer Tools open, you can start exploring the code of the web page. You can view the HTML, CSS, and JavaScript code, as well as the network activity and performance of the web page. You can also edit the code and see the changes in real-time.
Overall, Chrome Developer Tools is an essential tool for web developers and designers. It can help you troubleshoot issues, optimize performance, and improve the user experience of your web pages.
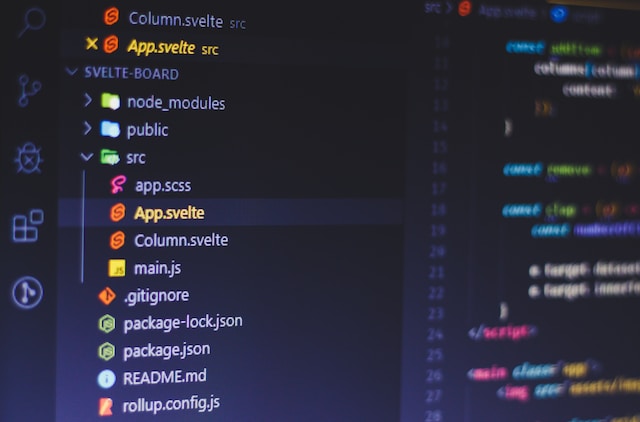
Navigating the Sources Panel
Once you’ve opened the Developer Tools, you’ll want to navigate to the Sources panel. This is where you can view and edit JavaScript code. There are several ways to do this:
Exploring the File Structure
The Sources panel displays all the files that make up a web page, including any JavaScript files. You can navigate through these files by expanding the file tree on the left-hand side of the panel.
Exploring the file structure can be helpful when you’re trying to understand how a web page is put together. By looking at the different files and how they relate to each other, you can get a better sense of the overall structure of the page.
In addition to JavaScript files, you’ll also see HTML and CSS files in the file tree. These files control the structure and styling of the web page, respectively.
Searching for Specific JavaScript Files
If you’re looking for a specific JavaScript file, you can use the search bar at the top of the panel to find it quickly.
This can be especially helpful if you’re working on a large web page with many different JavaScript files. Instead of manually scrolling through the file tree, you can simply type in the name of the file you’re looking for and quickly find it.
Once you’ve found the file you’re looking for, you can click on it to open it in the editor. From there, you can view and edit the code as needed.
Viewing and Editing JavaScript Code
JavaScript is a popular programming language used to create interactive and dynamic web pages. It is an essential part of web development, and being able to view and edit JavaScript code is crucial for developers.
Once you’ve found the JavaScript code you want to view or edit, you can do so using the Sources panel. The Sources panel is a powerful tool that allows you to inspect and modify JavaScript code in real-time. Here are some of the main features:
Inspecting and Modifying Code in Real-Time
The Sources panel allows you to view and modify JavaScript code in real-time. This means that you can see exactly what is happening in your code as it runs. You can set breakpoints, step through code, and even make changes to the code and see the results in the browser.
For example, if you are working on a web page that has a button that is supposed to change the background color when clicked, you can use the Sources panel to inspect the JavaScript code that controls the button. You can then modify the code to change the color to something else and see the results in real-time.
Setting Breakpoints and Debugging
If you’re having trouble with a particular piece of JavaScript code, you can set breakpoints to pause the code at a specific point. This allows you to debug the problem and find a solution.
For example, if your web page is not displaying the correct information, you can use the Sources panel to set a breakpoint in the JavaScript code that controls the information. When the code reaches the breakpoint, it will pause, and you can inspect the variables and values to see what is going wrong.
Overall, the Sources panel is an essential tool for any web developer working with JavaScript. It allows you to view and edit code in real-time, set breakpoints to debug problems, and gain a deeper understanding of how your web page works.
Working with the Console Panel
The Console panel is another useful tool for viewing and manipulating JavaScript code. Here are some of its main features:
Executing JavaScript Commands
The Console panel allows you to execute JavaScript commands directly. This can be helpful for testing code or performing quick calculations.
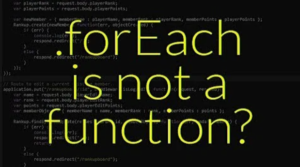
Analyzing Errors and Warnings
If you encounter an error or warning while working with JavaScript code, the Console panel will display it. You can use this information to diagnose and fix the problem.
Conclusion
Chrome’s Developer Tools make it easy to view, edit, and debug JavaScript code within web browsers. By using these tools, you can gain a deeper understanding of how websites function and troubleshoot any issues that may arise. Hopefully, this article has given you the knowledge you need to get started!